Your Survey Results

After closing your survey, results will be provided directly into your online dashboard within a few minutes.
Results will be available to all users that have been granted full or view access. You can log in at app.welbee.co.uk and you will need to use your email address and password.
Once logged in you will be taken to the home screen of your dashboard. This will show the individual scores and benchmarks for all six management standards that are measured. There are seven scores as Support is broken down into that provided by Managers and Peers. For a brief overview of the Management Standards, log into your Welbee Toolkit and go to Staff Wellbeing Foundations - What are management standards?
Scores
The scores range from 1 (low) to 5 (desirable). However, it is the comparative score that you will need to focus on. This is important as not all scores are equal, for example, you may score highly in some areas, though the comparative score is in a low decile, and vice-versa. Without these benchmarks, you may therefore incorrectly focus on areas where there is little prospect of improvement or ignore areas that need attention.
Benchmarks
There are two benchmarks.
- The School benchmark; your school's scores are benchmarked against other schools that have taken the survey with us.
- The (HSE) benchmark; this benchmark compares against 136 cross-sector organisations. This was established by the Health and Safety Executive. This will allow you to consider whether or not there may be learning from beyond the education sector. Some leaders find this very valuable, while others prefer to focus on school comparisons. The choice is yours.
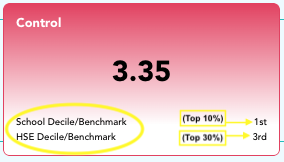
For both benchmarks your decile performance is shown and the higher the decile the better the comparative performance. For example, if your score is in the 1st decile like it shows for the school benchmark in the image below, it is in the top 10% of schools. While a 10th decile score would mean that more than 90% of schools have scored more highly.
Tracking trends and measuring impact
Completing future surveys enables you to track trends and will evidence any impact that is being made. After a second survey, progress will be displayed in a line graph within the home screen of your dashboard.

Related Articles
Survey Results - MATs and school groups
Overview: This section provides guidance on accessing survey findings for MATs and school groups. Upon closure of the survey, results will be promptly available on your online MAT dashboard and each school's dashboard. Access is granted based on user ...Results Review Meeting
Your results are feedback at one moment in time and the current school context cannot be ignored. Things may have happened locally that have had an impact and it is important to think about these when reviewing results. We want to make sure you get ...Survey Checklist
Survey Checklist Pre-Survey Preparation Set Key Dates: Establish your survey start and finish dates. Survey Planning: Review the knowledge base for tips on achieving a high participation rate. Obtaining a High Participation Rate Secure Leadership ...Closing your survey
You can close your survey using the button in the survey control panel on your dashboard. Once your survey is open you will be able to see the number of staff participating from within your dashboard. Ideally, you should try and achieve 80% ...Planning and preparation for your survey
Overview: Taking some time to plan and prepare your survey will ensure it's set up effectively and gets a good response rate from your staff. Here's what you'll need to consider: Before you start: Think about participation and results: Consider how ...